
Wednesday, April 17, 2013
Sunday, March 17, 2013
QCOM - Huge volume on friday
Under 65.90 expect further weakness and a test to 200 days e.m.a.

Trading levels : 64.45, 65.17, 65.53, 65.7/9 and 66.46...

Trading levels : 64.45, 65.17, 65.53, 65.7/9 and 66.46...
AMZN - Trading range (trading view)
Sideways trading points to a support in the 255.11/258.78 range.


Bulls must, at least, hold price above the blue line (5m chart). Then, one should expect a visit to the GAP (hourly chart).
AAPL - Again?
Can AAPL hit "200 days" this time?
For that to happen, bulls must hold 22 days e.m.a. or at least 440...

For that to happen, bulls must hold 22 days e.m.a. or at least 440...
Saturday, March 16, 2013
QQQ - Trading view
Can you see a rising wedge on the daily chart?
This is a bearish pattern, but if price can hold the 10 days e.m.a., one shouldn´t discard another move higher to at least 69.52.
I am expecting a test to the gap ([67.52, 67.94]) or even 67.23.


Trading levels: 67.23, 67.52, 67.94, 68.23, 68.34, 68.52/55, 68.70, 68.81/86, 69.02 and 69.52.
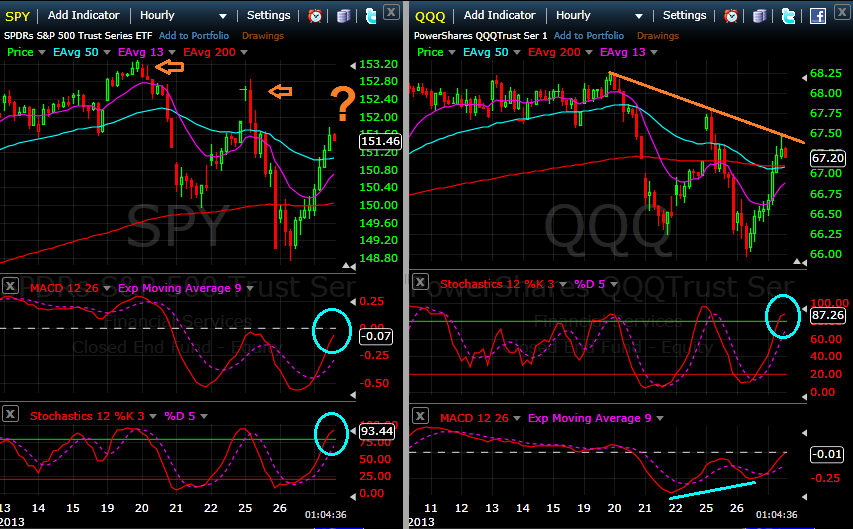
Wednesday, February 27, 2013
Strong pullback from new short term lows
Keep in mind weekly and daily levels.
Can Bears finally make a score or had we another bottom and are going straight up to 1550?
Can Bears finally make a score or had we another bottom and are going straight up to 1550?
Tuesday, February 26, 2013
Simple study (saturday Feb 23rd)
Under 1495 one should expect 1466 or even 1415/37.
Keep in mind weekly chart (if) under and last years highs...


Keep in mind weekly chart (if) under and last years highs...
Subscribe to:
Comments (Atom)